Abstract
As hazards and damages become more complex as population and progress evolve, strategies for minimizing or eliminating the impacts are not universal for all scenarios. Here in this paper, it proposes how to utilize a decision tree to determine a priority-scenario-based restoration strategy for a seismic damaged pipeline network. Using the available information of a city and the parameters for the pipeline system, the damage rate and losses after a seismic event can be obtained using available models. DTs were produced at different priority scenarios, namely: vulnerability, damage, and cost. Results show different areas affected by different priority scenarios. There were areas that are repeatedly highlighted in different priority scenarios. A priority-based strategy can be produced depending on whichever factor decisionmakers, consultants, or clients decide.
1. INTRODUCTION
Throughout human history, natural disasters had been destructive to our structures. Each event, structure, location, and factor is unique to other scenarios. With diverse information on parameters and cases, it is difficult to determine an exact intervention or strategy to be universally true for each scenario 1) 2). Water distribution networks (WDN) are extremely vulnerable to natural hazards, particularly seismic events. Losses and damages from these events are inevitable. These can lead to water disruptions which can affect the functions of a community 3). Numerous factors affect the impacts of hazards to pipeline systems 4).
Here, the restoration strategy aims to identify which parameters contribute to the highest ranking at each priority and their location under physical seismic damage on pipes.
As the world continues to grow and become more developed, obstacles in hazards, natural disasters, and recovery become more complex. As technologies globally improve, Artificial Intelligence and Machine Learning (ML) play an important role in hazard modeling and risk reduction 5) 6).
Here, we propose using the results from a decision tree (DT) to determine a restoration strategy depending on which parameter t prioritized, and how to optimize the loss. Here, the restoration strategy focuses on locating combination of parameters which contributes to the impacts brought by seismic damages. This method was proposed due to the complexities of the dataset and the uniqueness of impacts for different locations and events. Current studies use DTs as a predictive tool to obtain the optimized output depending on the input variables 7). In this paper, a model will produce which factors contribute to the highest outcome using the data obtained from a previous study.
Once the DT shows the parameters that contributed to the highest vulnerability, damage, or cost, they can be located using the GIS software.
Here, the DTs consider the hazard, vulnerability, and risk to identify crucial areas depending on the case to priority scenario. Results show different areas were considered crucial for each scenario priority. Combining scenario priorities was also considered.
In this paper, the analysis focuses on the physical impacts and losses on a Seismic-induced damaged WDN. Results show that different factors affect which priority to consider.
2. THEORY AND METHODOLOGY
Data used was obtained from a previous paper8). The data of the area was divided into 500m by 500m mesh. Each mesh is unique to each other corresponding to a specific point of the area.
The mesh size can be smaller, but due to the existing setup of the parameters and area size, the mesh size remains as is. The data includes the location of the point, amount of length, diameter size, diameter materials, total average loss, average damage rate, average damage spot, and probability of failure.
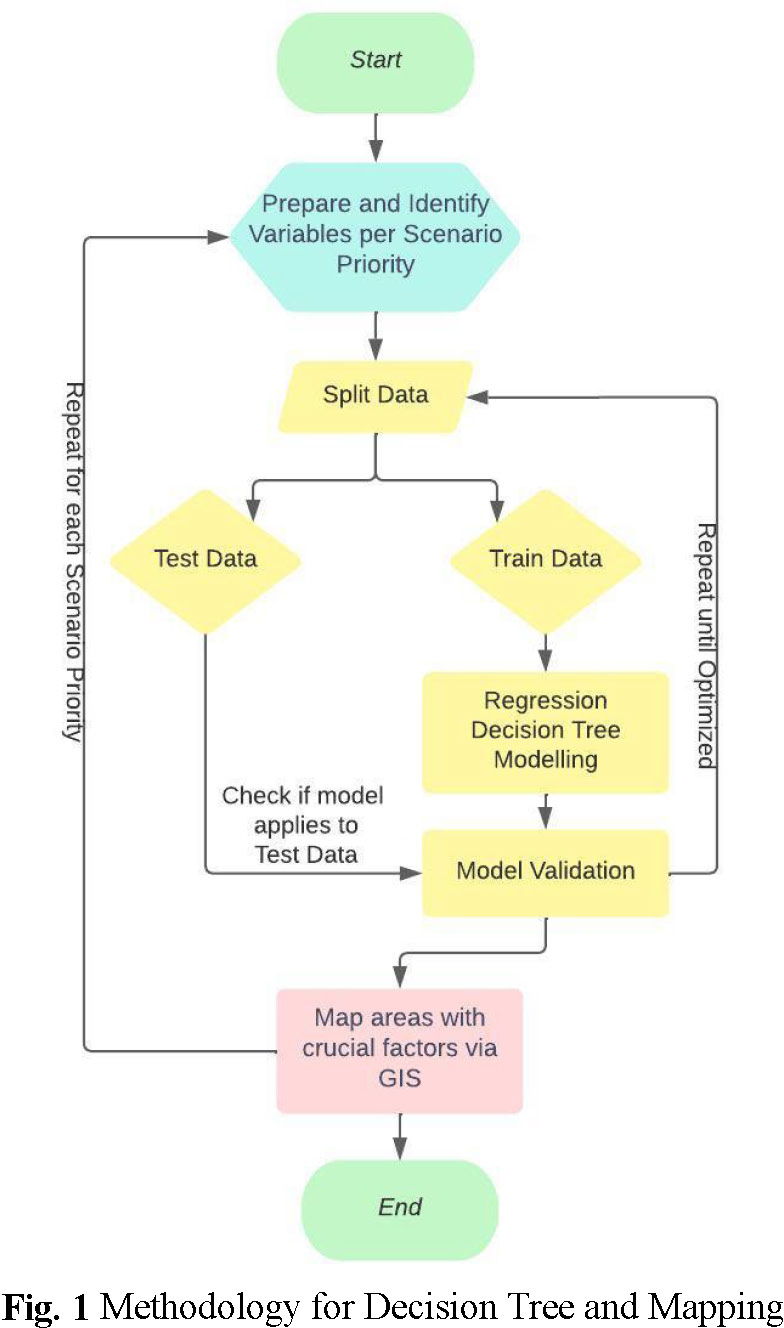
Figure 1 shows the methodology for creating the decision tree priority scenario restoration strategy. Depending on the priority intended, the input data was split to test data and train data. Train data is used to create the model, and the test data is used for validation. This was done for each scenario
(1) Probabilistic Seismic Hazard Analysis
Earthquake hazards were obtained from a previous paper8). Historical seismic data of the area were the parameters for the analysis. Probabilistic Seismic Hazard Analysis (PSHA) was used to obtain the peak ground velocity, V, and peak ground velocity, PGA, throughout the city9). Here, V was used to obtain the damage estimations; while the PGA was used as the input for the DT.
(2) Damage Estimation
Pipeline seismic damages can be estimated using the Isoyama et al (2000)10) method of estimating damages of pipelines per grid. Eq. 1 is the standard rate of damage. Where V is the peak ground velocity (PGV).
The variables Cp, Cd, Cg, and Cl are the correction coefficients for pipe materials, pipe diameter, ground condition, and liquefaction effect, respectively. Correction Coefficients are shown in Table 1.
The Average Damage Spot is shown in Eq. 3. Where rij is the Average Damage Spots per mesh i in category j, km; and Lij is the Length of pipes per mesh i in category j, km
Once the average damage spot is obtained, the probability of at least 1 break, Eq. (6).
(3) Cost Estimation
Once the average damage spot per mesh is obtained, the average loss was obtained using Eq. 7. Eq. (7) shows the average loss at each mesh area. Where, 𝑊̅i is the loss in each mesh per category, in this case, the diameter size, and α is the loss.
In this paper, loss is assumed to be cost of replacements during damages. The price of pipe replacement is shown in Table 2. The data was obtained from a hardware in 2018.
(4) Priority Scenarios
In this study, priority strategies focusing only on Physical Loss parameters were used. Here, there are three priorities to consider, namely: Vulnerability Priority, Damaged Priority, and Cost Priority. Vulnerability Priority focuses on areas and pipes that are highly vulnerable and susceptible to damage. This zeroes in areas and factors that have a greater chance of breakage. The damaged priority focuses on areas with the highest chances of damage. This focuses on the amount of damaged pipes projected in the area regardless of the level of vulnerability. And lastly, Cost Priority, this priority strategy focuses on rehabilitating or evading costly damages. The results project key factors and parameters that could contribute to high-cost damages.
The methodology was designed to add or modify the priority scenarios, such as locations of schools and hospitals, impacts of lifelines, impacts of population, and many more. However, due to the available data, only three priorities were considered
a) Vulnerability Priority
Vulnerability Priority, in this paper, is a strategy focusing on areas that have higher exposure to hazards and minimal protection against these hazards. The modified damage rate, nij , was used as the output for the decision tree. Input variables include PGV, material correction coefficient, and diameter size.
b) Damaged Priority
Damaged Priority focuses on areas with higher chances of damage, despite low exposure and high protection. In this research, the Damaged Priority Input Variables include PGA, pipe diameters, length of pipes, pipe materials, and Liquefaction Coefficient, while the Output Variable is the Ranked index of the Probability of at least 1 break, Pf.
c) Cost Priority
Here, Cost Priority is defined as a strategy focusing on minimizing financial losses. The model output is the cost, and the branches will show the factors that contributed to them. In this research, the Cost Priority Input Variables are the same as the damaged priority, while the Output Variable is the Ranked index of the Average Loss per mesh, 𝑊̅. Here in this paper, Cost Priority only focuses on the replacement cost of pipes for simplicity and availability. Labor cost, water loss cost, income loss etc. can be used or added to the Cost Priority in future studies.
d) Combined Priority Strategy
Combining priorities were considered in this study. Based on each priority scenario, i, the output data, Prji , was sorted in ascending order and each mesh, j, was assigned an integer based on its ranking, where 1 is the lowest priority ranking and k is the highest priority. The Combined Priority Index, IjT, for each mesh is obtained in Eq. 8.

Obtaining the ranking and ranking index was done to have a uniform unit of measurement for each priority scenario as shown in Eq.10. Where, Ii, is the Scenario Priority Index per mesh. Here, the priorities were combined, depending on the weight of importance assigned, αn. In this paper, the annotation n is equal to 1, 2, and 3; symbolizing the variables for Vulnerability, Damaged, and Cost Priority, respectively. It is assumed the summation of all weight of importance is equal to 1. The weight of importance is assigned depending on which priority importance scenario has a greater impact compared to the others, according to the decision-maker. In this paper, it was assumed that each Priority Scenario is equal to each, αn = 1/3.
(5) Decision Tree
This study proposes the use of decision trees as a tool to determine restoration strategy depending on the factors decision-makers want to prioritize. Here, Classification and Regression tree analysis (CART) is used to determine which factors contribute the most to cost, damage, or loss demand in the system. Using CART, it can show which factor contributes more to the output.11)12) Due to the simplicity and visually easy to understand for users and interpreters, this method is preferred over other ML tools. The goal of this is for different decision-makers to understand and apply the methodology.
To create the decision trees, Python was used. DTs were produced from 70% of the data, the rest was used to validate the model.
(6) ArcGIS Mapping
Once all the crucial factors that contribute to each priority scenario are obtained, they can all be overlaid in any GIS software. Here, ArcGIS was used.
3. RESULTS AND DISCUSSION
The area used for this was Iloilo City, Philippines as shown in Figure 2. The city was chosen due to data availability as this is a research continuation.8) The city also has three fault lines and developing. The produced results are shown below. Average Damages Rates, Average Damages Spots and Replacement Cost were results in the previous study.
Figure 2 shows the map setup of the initial data. The pipes were categorized by pipe diameter through color-coding. The pipes with the color Sky were identified with a diameter of 50mm, Grey was 75mm, Green was 100mm, Violet and Blue were 150mm, Pink was 250mm and Orange was 200-600mm.
The materials of the pipes differ for each location and size. The results include the decision tree, scattered plot of predicted vs trained results, scattered plot of predicted vs test results, and the map to determine which area the decision tree highlights.
The scattered plots show the consistency of the model for the trained data and test data.
(1) Vulnerability Priority Strategy
Figure 4 shows DT for the Vulnerability Priority Strategy. Each iteration of the DT had to compare the coefficient of determination, r2, and the RMSE, root mean square error, of model predicted results vs trained data (Fig. 5) and Model predicted results vs test data (Fig. 6) to validate the results. The hyperparameters were assessed to obtain the optimum decision tree. The y-axis of Fig. 5 and 6 is the model predicted results. The values in this axis came from the DT.
The x-axis in Fig 5 is the trained results, the values are the randomized 70% ranked values that were used to create the DT; while the x-axis in Fig 6 is the test results, this is the remaining random 30% of the ranked results to check if the model is still consistent.
The optimum DT produced shows 15 splits. Each number of splits starting from 3 was analyzed. The number of splits was increased until R2 for model predicted results vs trained data and model predicted results vs test data are at the highest and before decreasing. Though increasing the splits for model predicted results vs trained data can still increase the r2 and decrease the RMSE, the r2, and RMSE for model predicted results vs trained data will do the opposite after surpassing the optimum number of splits.
The results from the DT show which factors contribute to higher vulnerable pipes. Areas with only pipe diameters from 50 to 150 mm and affected with 0.322g show higher vulnerability.
Figure 7 shows the GIS results for the Vulnerability Priority Strategy. These are areas that have a combination of parameters that have the highest vulnerability priority ranking based on the DT model.
(2) Damaged Priority Strategy
Like the Vulnerability Priority Strategy, results include the DT, scatterplots, and a map that highlights the location of the crucial area. However, the results from the decision tree show that there is one crucial factor that contributes to the high chances of damage, and that is the length. Areas to prioritize under the Damaged Priority Strategy are shown in Fig 7.
(3) Cost Priority Strategy
For the cost, a combination of length of pipes, bigger diameter contributes to higher cost of damage. Pipes with larger pipes and weaker materials, specifically the orange pipes with Cp >= 0.714. Fig 8 shows the areas to prioritize under the Cost Priority Strategy. Areas highlighted in this priority are clustered different areas compared to the Vulnerability and Damaged Priority.
(4) Combined Priority Strategy
Here, it is assumed that each priority is equal to each other. Results show a combination of the impacts of the PGA and the length of pipes per mesh contribute the most when it was assumed all priority scenarios are equally important. Areas highlighted in Fig. 9 are sites to prioritize in the combined Priority Strategy where each scenario are equally important. Comparing with other Priority Strategies, the crucial are different with the others, however, there are also areas that are repeatedly highlighted.
4. CONCLUSION
The paper was able to present a priority restoration strategy using a regression decision tree. Since the parameters and conditions are different to one another, it is recommended to use the advantages of the decision tree to organize each variable to create a model. Based on the DTs, it can be observed which factors affect higher priority per scenario. Different locations were highlighted for each priority.
Combining the Scenario Priorities shows which areas are crucial when the weight of importance was considered. It is recommended to include the functionality and correlation in future studies. At this stage of the research, the accuracy of the proposed model has not yet been verified; therefore it is recommended for future studies.
References
- 1) Mysiak, J. : Integrating Disaster Risk Reduction and Climate Change Adaptation for Risk-informed and Climate-smart Development. Issue-based Coalition on Environment and Climate Change Task Team on Disaster Risk Reduction and Climate Change Adaptation, 2021.
- 2) Global Programme on Risk Assessment and Management for Adaptation to Climate Change (Loss and Damage): Climate risk management - Promising pathways to avert, minimise, and address losses and damages, 2021. https://www.giz.org/en/downloads/giz2021-en-promising-pathways-to-avert-minimise-and-address-losses-and-damages.pdf
- 3) Makhoul, N., Navarro, C., Lee, J. S., and Gueguen, P.: A comparative study of buried pipeline fragilities using the seismic damage to the Byblos Wastewater Network. International Journal of Disaster Risk Reduction, Vol. 51, No. 101775, 2020.
- 4) Akram, M. R. and Can ZÜLFİKAR, A.: Identification of factors influencing sustainability of buried continuous pipelines. Sustainability, Vol. 12, No. 3, pp. 960, 2020.
- 5) Linardos, V., Drakaki, M., Tzionas, P., and Karnavas, Y.: Machine learning in disaster management: Recent developments in methods and applications. Machine Learning and Knowledge Extraction, Vol. 4, No. 2, pp. 446-473, 2022.
- 6) Kuglitsch, M. M., Pelivan, I., Ceola, S., Menon, M., and Xoplaki, E. : Facilitating adoption of AI in Natural Disaster Management through collaboration. Nature Communications, Vol. 13 No. 1, 2022.
- 7) Irimia-Dieguez, A. I., Blanco-Oliver, A., and Vazquez-Cueto, M. J.: A comparison of classification/regression trees and logistic regression in failure models. Procedia Economics and Finance, Vol. 23, pp. 9-14, 2015.
- 8) Jarder, S.L.N., Garciano, L.E.O. and Maruyama, O.: Probable maximum loss of a pipe network due to earthquakes: a case study in Iloilo city, Philippines", International Journal of Disaster Resilience in the Built Environment, Vol. 12 No. 2, pp. 223-237, 2021.
- 9) Kramer, S.L. : Lateral Spreading. In: Bobrowsky, P.T. (eds) Encyclopedia of Natural Hazards. Encyclopedia of Earth Sciences Series, 2013.
- 10) Isoyama, R., Ishida, E., Yune, K., & Shirozu, T.: Seismic Damage Estimation Procedure For Water Supply Pipelines. In 12th World Conference on Earthquake Engineering, 2000.
- 11) Chen, M. Y., Chang R. C., Chen L. S., and Shen, E. L.: The key successful factors of video and mobile game crowdfunding projects using a lexicon-based feature selection approach, Journal of Ambient Intelligence and Humanized Computing, Vol. 13, pp. 3083-3101, 2022.
- 12) Huynh-Cam T. T., Chen L. S., Le H.: Using Decision Trees and Random Forest Algorithms to Predict and Determine Factors Contributing to First-Year University Students’ Learning Performance. Algorithms, Vol. 14, No. 11, pp. 318, 2021.
- 13) Sosuan, F. L. A., & Fillone, A. M.: Mode Choice Analysis of Urban Trips in Iloilo City. In Proceedings of the 22nd Annual Conference of the Transportation Science Society of the Philippines, 2014.